 Docs
Telemetry collectors
Every collector the sensor ships, what each watches, the kernel mechanism it rides, and the blind spot it declares. The default build is pure Go and GPL-free; the heavier kernel taps are opt-in. Collectors are visibility. The verdict layer that reads them lives in Detection engines.
What runs by default
Two steps, not one, and deliberately so. The plain one-liner installs the signed binary and starts nothing: a server that only wants a resolvable identity is never surprised by a new collector appearing on it.
$ curl -fsSL https://get.whisper.online | shAsk for the sensor and it starts with every collector on:
# curl -fsSL https://get.whisper.online | WHISPER_SENSOR=1 shThat installs the binary and a dedicated whisper-sensor unit, running immediately. From there nothing needs enabling one by one: every collector in the table below, and every detection engine that reads them, ships on by default. The default build carries no cgo and no GPL object. Its core collectors are the exec collector on the kernel NETLINK process-connector, the file collector on fanotify, the outbound and inbound socket collector on NETLINK_SOCK_DIAG, and the DNS attribution tap on AF_PACKET. A critical-config integrity watch and a vulnerability-posture collector ship in the same pure-Go build. A lower-overhead eBPF exec and per-connect tap is a separate opt-in build behind -tags ebpf, which links a GPL-2.0 object and is never in the public MIT tree.
Kernel-graceful, fail-open. A collector that cannot attach on a given kernel is dropped, and the sensor keeps running on the rest. It never fails the host. The default exec path needs no eBPF, so it runs on kernels well below 5.3.
One stream, four vocabularies, forward-first
Everything the collectors see rides one telemetry stream in four vocabularies: exec, file, conn and dns, plus a fifth detection kind that engine findings ride back on. The rule that shapes the whole sensor is forward-first: the hot path always forwards an event downstream before any detector looks at it. Detectors attach either as taps spliced inline that forward first and fold a judgement on the side, or as observers that side-consume copies and by construction cannot delay, change or lose a single event.
The stream is also defended at the source. Both netlink collectors accept only datagrams from the kernel itself (source port-id 0) and bind each dump to a fresh sequence number, so a local attacker cannot fabricate exec or connection records to bury the real ones. The exec collector carries a PID-recycle guard: if /proc turns out to be newer than the exec event it is enriching, it drops the stale identity rather than attribute the wrong binary. The collector set behind this page carries 2,112 test functions and 93 fuzz targets across 216 test files.
The collectors, at a glance
| Collector | Watches | Mechanism | Platform | Status |
|---|---|---|---|---|
| Process exec | every execve, /proc-enriched | NETLINK proc-connector | Linux | Live · default |
| Process exec (deep) | same, lower overhead + earlier | eBPF | Linux ≥ 5.3 | Opt-in · -tags ebpf |
| File changes | create / modify / delete | fanotify | Linux | Live · default |
| Settled-hash lane | SHA-256 of settled new executables | fanotify CLOSE_WRITE + bounded drain | Linux | Live · default |
| Critical-config watch | writes to sensitive paths | fanotify + closed path allowlist | Linux | Live · default |
| Sockets, both directions | outbound connect + inbound accept | NETLINK_SOCK_DIAG | Linux | Live · default |
| Per-connect net-tap | each new connection at SYN_SENT, source port | eBPF | Linux ≥ 5.3 | Opt-in · -tags ebpf |
| DNS attribution | qname to originating process | AF_PACKET + classic BPF filter | Linux | Live · default |
| Inventory + posture | packages, open CVEs, SBOM-lite | distro metadata | Linux | Live · default |
| Windows ETW | exec / file / network telemetry | ETW | Windows | Live · telemetry |
| macOS ES bridge | EndpointSecurity + NetworkExtension events | ES daemon over NDJSON | macOS | Live · entitlement-gated |
Process exec
The exec collector is the spine of the sensor. By default it reads the kernel NETLINK process-connector, a pure-Go path with no cgo and no GPL, and enriches each execve from /proc (argv, exe path, uid, ppid) with the PID-recycle guard described above. The image's SHA-256 and its known-good verdict are computed asynchronously, off the hot path, so enrichment never slows the stream. The opt-in eBPF build sees execs earlier and at lower overhead, and links a GPL-2.0 object, so it is kept out of the public MIT tree and turned on deliberately with -tags ebpf. Either way the event shape is the same. This is the raw stream behind the measured 100% telemetry run:
[T1003.008 read /etc/shadow]  {"comm":"cat","filename":"/usr/bin/cat","pid":1658,"ppid":1656,"uid":0}
[T1547.006 kernel module]     {"comm":"insmod","filename":"/usr/bin/kmod","pid":1875,"uid":0}
[T1027 obfuscation]           {"comm":"base64","filename":"/usr/bin/base64","pid":1986,"uid":0}
[T1071.001 C2 user-agent]     {"comm":"curl","filename":"/usr/bin/curl","pid":2018,"uid":0}
[T1105 ingress transfer]      {"comm":"rsync","filename":"/usr/bin/rsync","pid":7495,"uid":0}
On that run the exec collector captured 17,092 exec events with zero drops, including one scan loop that alone spawned 10,974 processes. The full matrix is in ATT&CK coverage.
File changes, the settled-hash lane and the critical-config watch
The file collector rides fanotify for create, modify and delete, resolving paths via file handles rather than racy name lookups. Two lanes sit on top of it.
The settled-hash lane: when a new ELF or script closes for write, its settled content is digested on a bounded side lane and a SHA-256 hash annotation joins the stream. That annotation is what feeds the YARA scanner and the known-good hash verdicts downstream. The lane is bounded by design: a hashing storm sheds digests, never the drain, so a mass file-drop can cost you some hashes but never your file telemetry.
The critical-config integrity watch carries a closed, hard-coded allowlist of 16 classic Linux persistence and privilege-escalation paths, each pre-tagged with its ATT&CK technique: the dynamic-linker preload files, the cron directories, systemd and init service paths, the sudoers files and the SSH daemon config. It marks parent directories so a file that does not exist yet (a fresh /etc/ld.so.preload) is caught at creation, filters every non-allowlisted sibling, and refuses to follow symlinks so a link-swap race cannot redirect the watch. The write is captured the moment it happens, not inferred after the fact:
# the config-watch collector, on a critical file write:
[T1574.006 ld.so.preload]  {"kind":"file","event":"create","path":"/etc/ld.so.preload","critical":true}
Sockets, the net-tap and DNS attribution
Network visibility is three collectors, each answering a different question, and each declaring what it cannot see.
- Sockets, both directions on
NETLINK_SOCK_DIAG: a calm periodic dump of established TCP and connected UDP, v4 and v6, classifying direction against a per-tick listener snapshot so a dialed-out connection and an accepted-inbound one are labelled distinctly. This is what makes east-west and inbound exposure visible at all, and it runs unprivileged. - Per-connect net-tap (eBPF, opt-in): one event the instant a TCP dial reaches
SYN_SENT, carrying the same source-port flow key as the DNS tap, the short-lived-connection fidelity a periodic dump structurally cannot have. Nothing in it can influence whether a connect succeeds. - DNS attribution on
AF_PACKET: the resolved qname joined to the process that asked, so a lookup of a bad domain is attributable to a binary, not just to the box.
The DNS tap deserves its mechanics spelled out, because it is the rarest edge any EDR draws and it uses no resolver plugin and no eBPF. A classic BPF filter is attached before the socket binds, so the kernel only ever delivers outgoing UDP datagrams to destination port 53; the sensor never sees unrelated traffic. The DNS question is decoded by a bounded, total parser (RFC-1035 255-octet name cap, at most 8 compression jumps), and the querying process is recovered post-hoc: the datagram names the querying socket by source port, the source port maps to a socket inode via one bounded /proc/net/udp scan, and the inode maps to a PID through a one-second-TTL reverse index. Attribution is budgeted at 64 lookups per second; past budget, or when the socket is already gone, the event degrades to PID 0, a held-but-unattributed node, never a lost edge and never a /proc churn storm. The tap watches exactly the hop that carries the real querying process (the stub-resolver hop to systemd-resolved or dnsmasq), and it says plainly what it cannot see: DoT and DoH bypass port 53 and are simply not observed.
Why carry a source port on a DNS event at all? Because real tooling splits the resolve and the connect across different processes (a shared system resolver asks, the payload process dials). The shared ephemeral port is the flow key that lets the backend fuse the resolve and the connect back together across that split. Together the three taps power the write-exec-connect event chain and the exfil-fusion join, folded into the per-endpoint graph; the three-graph story they enable is in How the sensor works, and what the verdict layer makes of them is in Detection engines.
Inventory and vulnerability posture
The posture collector enumerates the host's own packages, its open CVEs and an SBOM-lite from distro metadata. Collection is self-contained: no heavy client-side SBOM upload. The graph then ranks the findings by KEV, EPSS, CVSS and known-ransomware use, so a fleet of thousands of CVEs distills to the handful worth fixing first. On a real box:
That run surfaced real Known-Exploited entries including Log4Shell (CVE-2021-44228). The collector is read via op:list{kind:'posture'}.
The gate. The posture collector is live. The graph-side CVE severity scoring (the KEV and EPSS ranking) runs against a pre-production corpus today and promotes to the production graph on a dated gate, so treat the ranking as beta while the collection itself is solid.
What heavy work costs, and when it runs
Collection itself is cheap by construction; everything that is not cheap (full-file hashing, deep scans, inventory sweeps) is deferrable work handed to the calm scheduler, which admits it only when the host is idle, on workers at nice 19 with idle I/O priority, under the sensor's own cgroup ceiling. Starvation floors guarantee that a fresh unknown executable is still examined within about a minute even on a busy host. The measured whole-sensor footprint is roughly 2.6% of one core and 16 MB; the scheduler, the floors and the ceilings are in Calm footprint & SLA.
Windows and macOS
The deep on-host sensor runs on Linux and Windows today, and macOS already emits telemetry through the same wire contract.
Windows ETW is live: one real-time session over four manifest providers carries exec, file, connection, DNS and image-load telemetry, a pure-Go user-mode collector with no kernel driver, and the ransomware, dropper-chain and process-injection engines run over those streams on-host, proven on a real Windows Server 2022 host. The ETW-TI tier is built but dark, gated on Microsoft's anti-malware attestation, not on engineering; the Vulnerable-Driver blocklist matcher is wired unconditionally and live, registered alongside the rest with no config knob of its own.
macOS ships an EndpointSecurity and NetworkExtension bridge that ingests the native ES daemon's events over an authenticated local socket, sharing the same Go core and a byte-identical event contract proven against the Linux golden corpus. Customer ship is gated on the Apple EndpointSecurity entitlement, so it is internal and dev today, not a shippable tier. The full matrix is in Platform support.
Whatever the OS, identity, resolution and the off-host kill-switch already cover any host or agent on the network. A device that will never run a kernel sensor (a PLC, a camera, a contractor laptop, an ephemeral AI agent) still gets a verifiable /128 and can be contained from the network with no agent installed.
Where the telemetry surfaces
Collector output becomes a queryable per-endpoint census, enriched with a trust tier and an affirmative known-good verdict so the analyst sees the calm majority, not just red. The API key stays server-side; the read is op:list{kind:'proc'}:
$ curl -s https://graph.whisper.online/api/query \
    -H 'X-API-Key: whisper_live_...redacted' \
    -H 'content-type: application/json' \
    -d '{"query":"CALL whisper.agents({op:\"list\", kind:\"proc\",
             address:\"2a04:2a01:8dae:4521:45b8:b241:4f91:56e2\", limit:500})"}'

envelope: op=list  ok=true  status=200  elapsed_ms=66
processes returned : 500
hash-verdict known-good (fleet allowlist) : 52
known-good on THIS host                   : 54
carrying a signal                         : 62

# sample rows (host web-edge-01; known-good rides the signal list)
exe=/usr/bin/wg    trust=T3  knownGood=true  onHost=true  signals=[hash-verdict:known-good,hash-verdict:known-good-onhost]
exe=/usr/bin/ip    trust=T3  knownGood=true  onHost=true  signals=[hash-verdict:known-good,hash-verdict:known-good-onhost]
exe=/usr/bin/bash  trust=T2  knownGood=true  onHost=true  signals=[fan-out:8,sensor-rep:32,hash-verdict:known-good]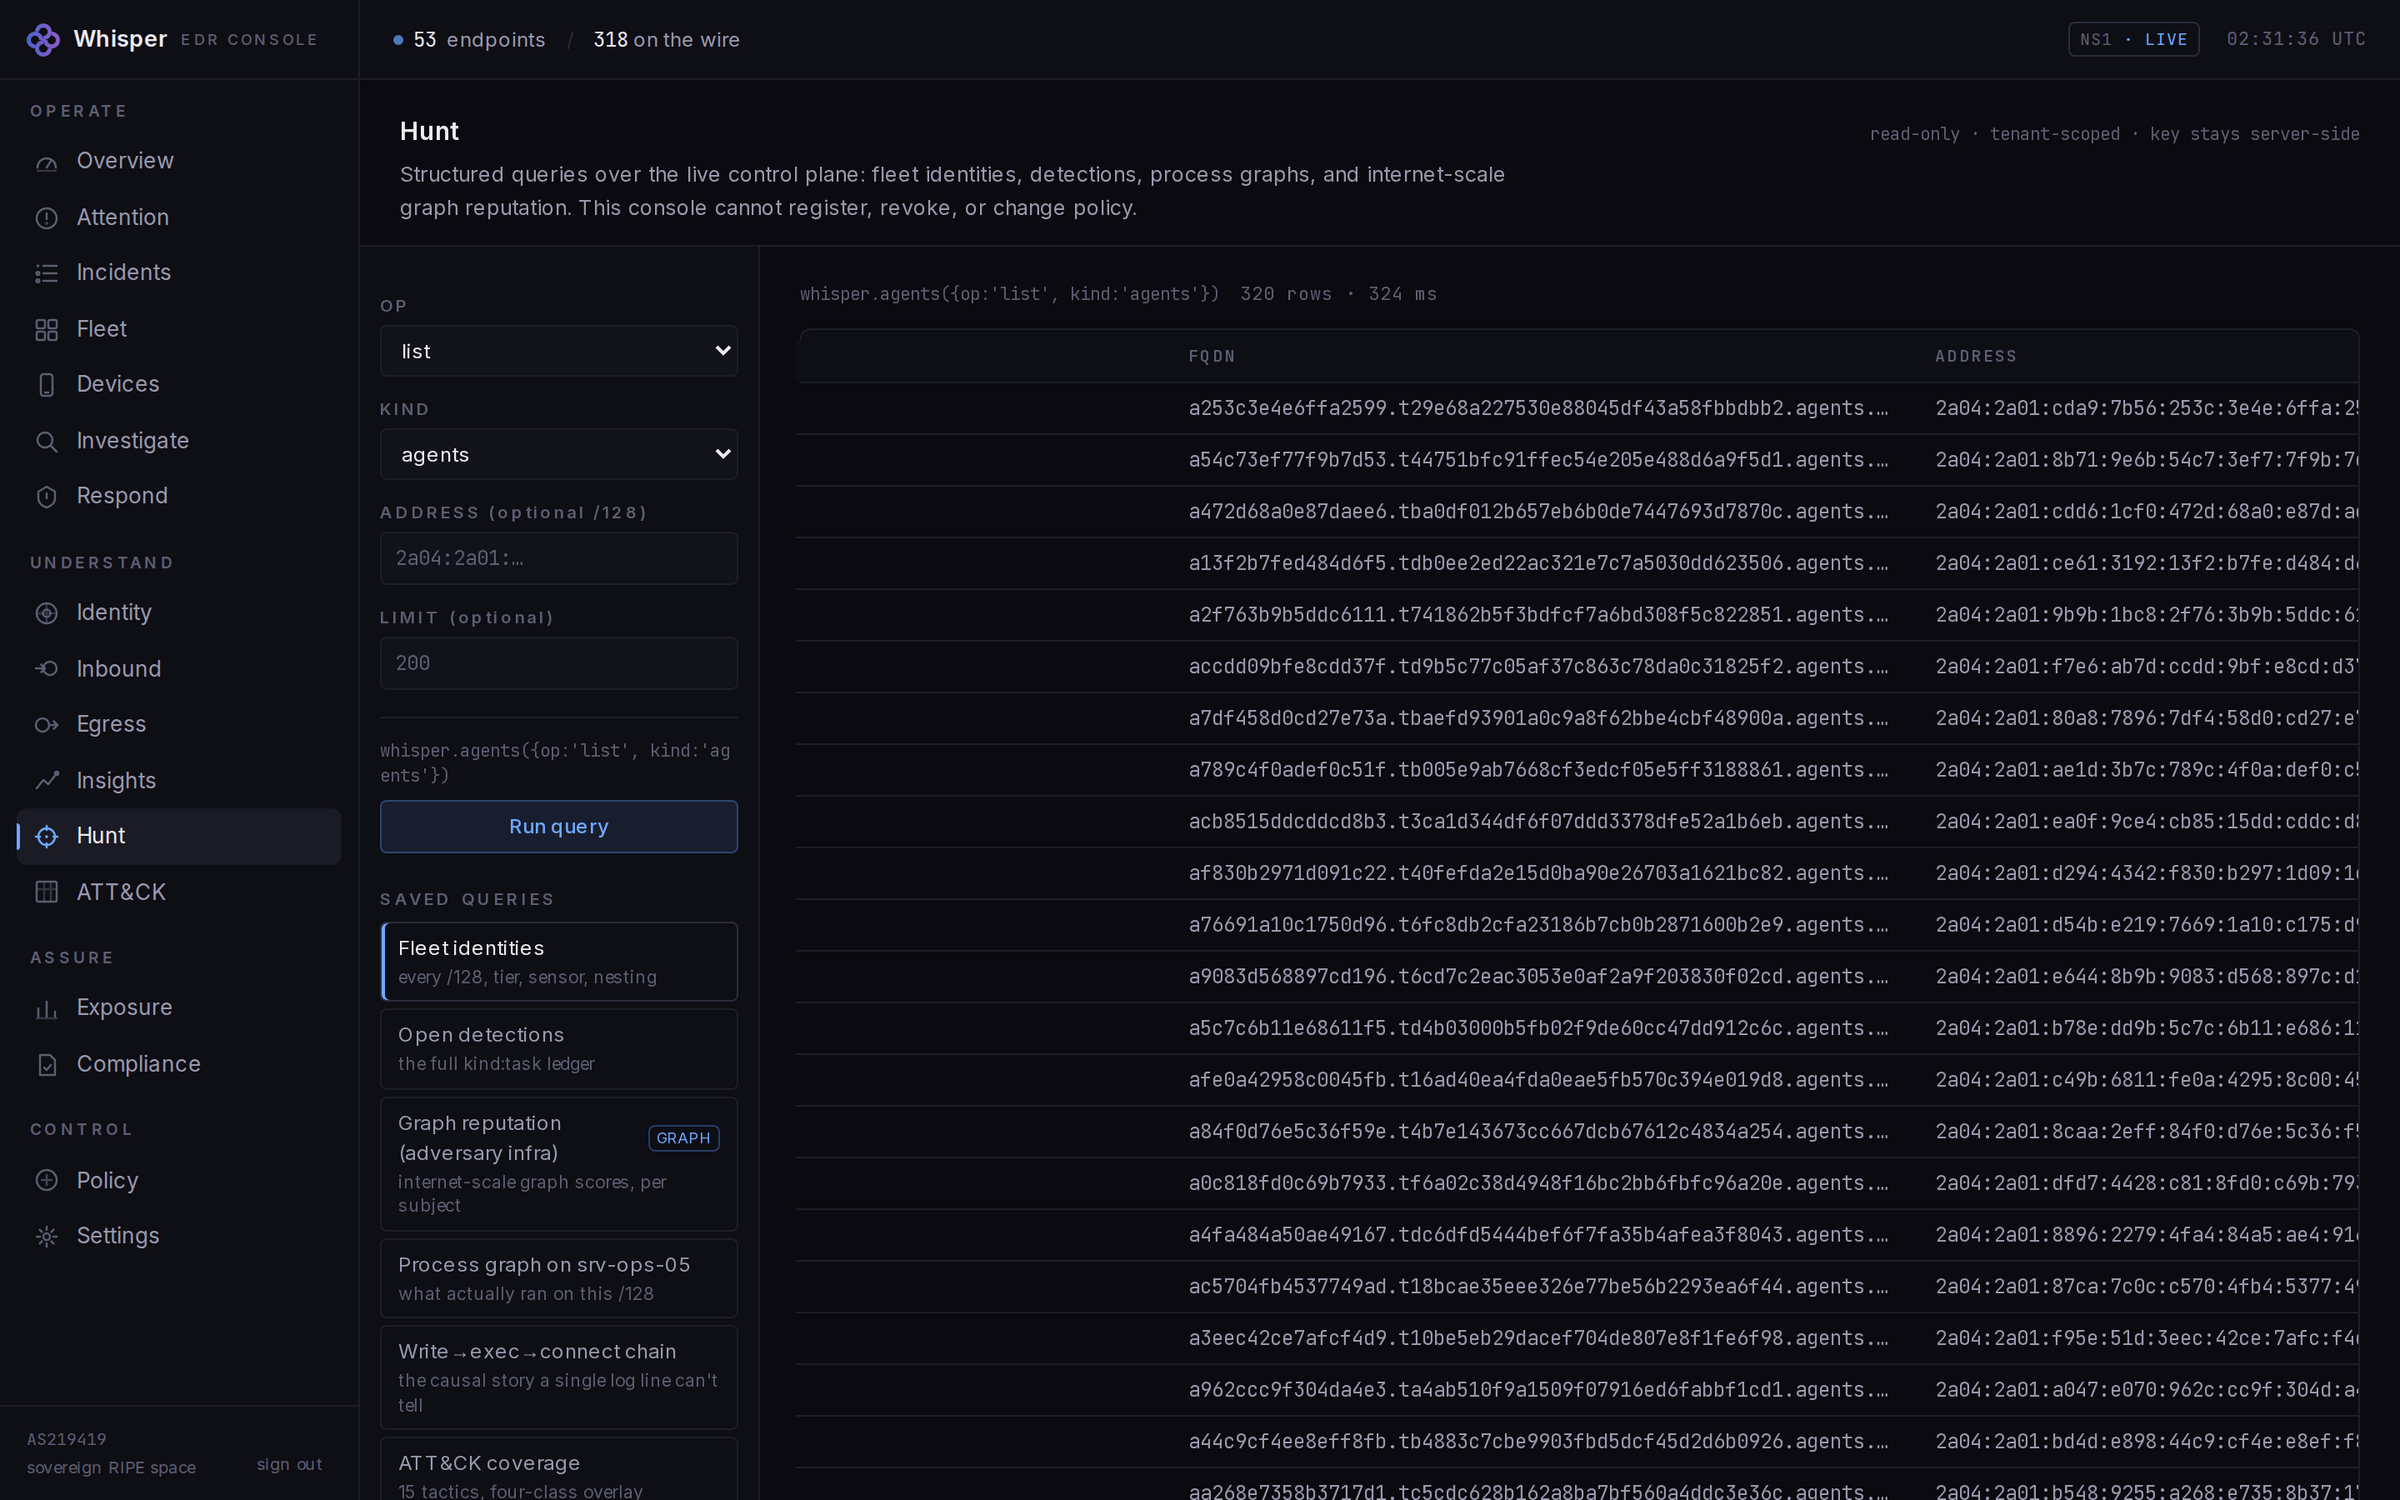
Telemetry is not a verdict. Everything on this page is visibility: the sensor sees the event. Turning that stream into an analytic verdict that alerts is a separate layer, documented in Detection engines, and we keep the two strictly apart.