 Docs
ATT&CK coverage
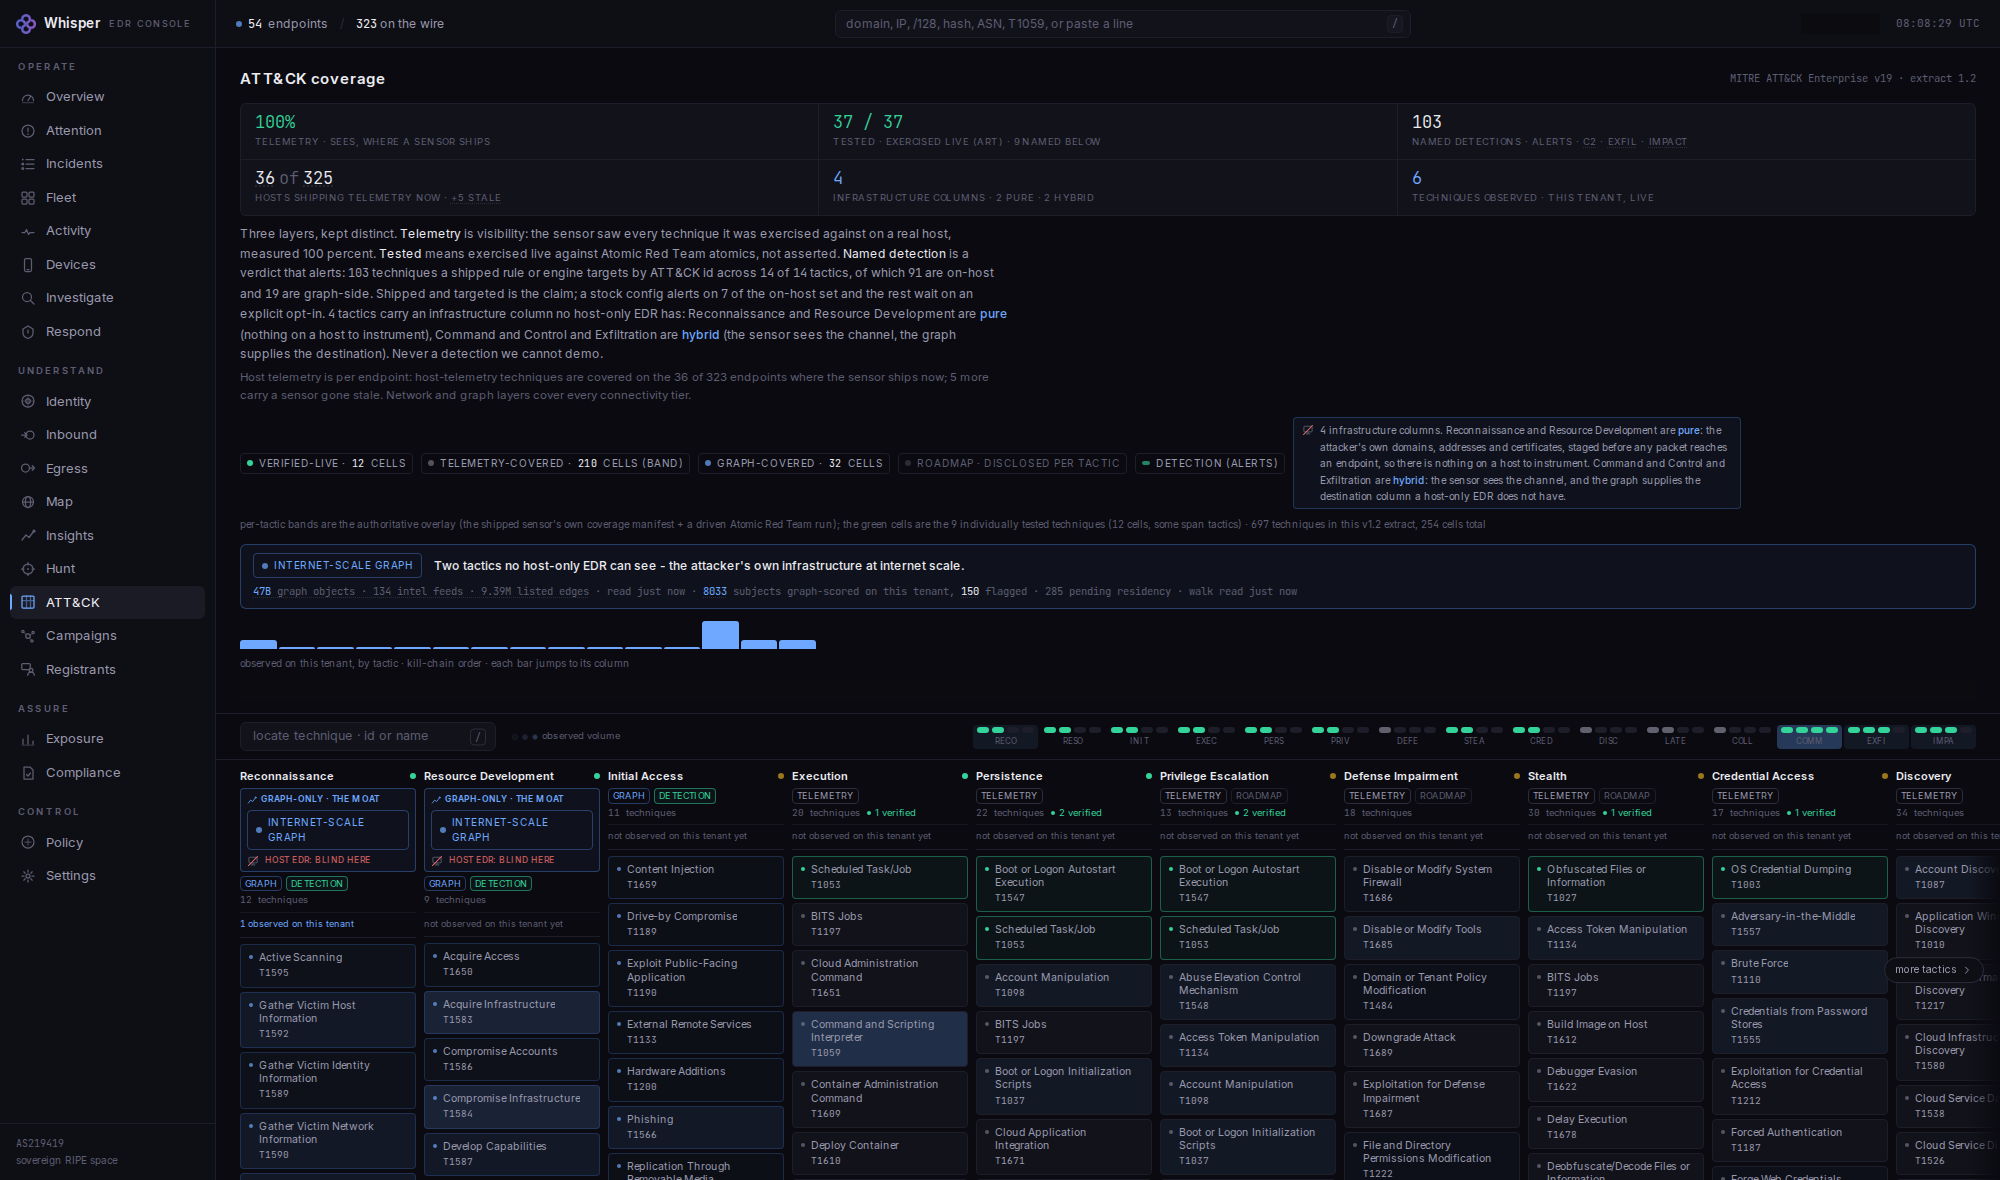
Coverage of the whole kill chain, all 14 MITRE ATT&CK Enterprise tactics, including the four columns a host-only EDR is structurally blind to: the attacker's own infrastructure, before and after it touches your endpoint.
A shipped rule or engine names 103 ATT&CK techniques by their technique id today (68 counted at the parent technique, sub-techniques folded in), across 14 of 14 Enterprise tactics. 91 of those are on-host, carried by 12 behavioral engines, 79 bundled Sigma rules and a curated critical-config watch running natively in the sensor. The remaining 19 are the four infrastructure columns, Reconnaissance TA0043, Resource Development TA0042, and the infrastructure side of Command and Control TA0011 and Exfiltration TA0010, emitted from the 7.52B-node / 38.6B-relationship internet graph. A host sensor cannot reach those four, because the activity happens on the adversary's own machines.
Two numbers, never one. Telemetry is what the sensor sees, measured at 100% (37 of 37 driven techniques) on a real box. Named detection is what alerts, the 103 techniques above. We publish both and we never restate one as the other. Named detection means a shipped rule or engine targets that technique by its ATT&CK id and can alert on it, which is a claim about the artifact we ship, not a claim that we have watched every one of them fire.
The four columns no host-EDR covers
Two of them are pure: Reconnaissance and Resource Development happen entirely on the adversary's own infrastructure, their domains, addresses, certificates and staged capabilities, long before a packet reaches an endpoint. There is nothing on a host to instrument, so a CrowdStrike or SentinelOne sensor is not weak here, it is structurally absent. Two are hybrid: for Command and Control and Exfiltration the sensor sees the channel and the graph supplies the destination column a host-only product does not have.
| Column | Named techniques | What the finding is made of |
|---|---|---|
| Reconnaissance TA0043 pure | 6 | T1595, T1595.002, T1590, T1591, T1589, T1598. Scanning and victim-information gathering seen from the resolver and the graph's own view of the scanning infrastructure. |
| Resource Development TA0042 pure | 6 | T1583, T1584, T1585, T1586, T1588, T1608. Acquired and compromised infrastructure, staged capabilities, corpus-confirmed hashes. |
| Command and Control TA0011 hybrid | 5 | T1071.001, T1568.002 (DGA), T1572, T1090, T1102. The destination's reputation, the tunnel and proxy corpus, the DGA burst shape. |
| Exfiltration TA0010 hybrid | 2 | T1048, T1567. A resolve-to-connect chain to a destination the graph scores derogatory, corroborated by per-/128 egress byte metering. |
Every one of these fires only when the graph itself made a derogatory claim: a threat band, a known-bad listing, a threat-classification label, a corpus-confirmed hash, or a verbatim match against the same out-of-band-interaction provider list the bundled Sigma rule uses. An unlabelled, unbanded, unlisted signal contributes nothing. Confidence is a fixed function of the signal, never tuned per finding, and every finding carries a re-runnable receipt: the exact CALL whisper.assess or whisper.enrich a stranger can run to reproduce the verdict.
The on-host set, by platform
91 techniques (57 at the parent) are named by something running in the sensor itself. The count is not hand-maintained: it lives in a coverage manifest embedded in the binary, and the build guard recomputes it from the shipped artifacts, the Sigma rules' own tags through the same parser and platform admission the evaluator uses, the engines' compile-time technique constants, the critical-config allowlist. Adding a detection without updating the count is a test failure, not a documentation drift.
| Platform | Named techniques | At the parent technique | Notes |
|---|---|---|---|
| Linux | 45 | 32 | The flagship. Four collectors, every engine, no feed gate. |
| Windows | 44 | 35 | ETW Kernel-Process, File, Network, DNS-Client and image-load. |
| macOS | 70 | 46 | feed-gated Every macOS entry is feed-gated: the streams arrive through the Endpoint Security and NetworkExtension bridge, and the deep feed needs Apple's Endpoint Security entitlement. |
The platform columns overlap, because one bundle carries every platform's layer side by side and load-time admission selects the subset the running binary can observe.
The default posture, stated plainly. This flipped since the last measurement: all 91 alert on a stock config with the sensor turned on. The ransomware pair (T1486, T1490) and the critical-config watch (T1053.003, T1543.002, T1548.003, T1574.006) were always on-by-default and stay that way; the driver blocklist (T1068) carries no config key at all, so there was never anything to flip. What changed is the rest: the Sigma evaluator, the injection sweep, the event-chain correlator and the six behavioral correlators (lateral-movement, defense-evasion, collection, credential-access, DGA, JA3/JA4) now ship on by default too, each its own opt-out key rather than an opt-in. The one thing still off by default is YARA, and it isn't really an exception to this posture so much as a separate axis: the default release binary never compiles the engine in, so there's nothing to opt into until you build with -tags yara yourself, at which point it defaults on as well. The exact key for every engine is on Detection engines.
Measured live, the transcript
On a throwaway Debian 12 box (kernel 6.1), driving real atomics: 100% telemetry (37 of 37 techniques captured, 10 tactics), 32 of 37 signature (86%, the known tool captured by name; the five not named were still captured as telemetry), 17,092 exec events with zero drops (one scan loop alone spawned 10,974 processes). Verbatim captured events:
[T1003.008 read /etc/shadow]  {"comm":"cat","filename":"/usr/bin/cat","pid":1658,"ppid":1656,"uid":0}
[T1489 service stop]          {"comm":"systemctl","filename":"/usr/bin/systemctl","pid":1718,"uid":0}
[T1053.003 cron persistence]  {"comm":"crontab","filename":"/usr/bin/crontab","pid":1732,"uid":0}
[T1547.006 kernel module]     {"comm":"insmod","filename":"/usr/bin/kmod","pid":1875,"uid":0}
[T1027 obfuscation]           {"comm":"base64","filename":"/usr/bin/base64","pid":1986,"uid":0}
[T1071.001 C2 user-agent]     {"comm":"curl","filename":"/usr/bin/curl","pid":2018,"uid":0}
[T1485 data destruction]      {"comm":"dd","filename":"/usr/bin/dd","pid":7462,"uid":0}
[T1105 ingress transfer]      {"comm":"rsync","filename":"/usr/bin/rsync","pid":7495,"uid":0}
[T1574.006 ld.so.preload] {"kind":"file","event":"create","path":"/etc/ld.so.preload","critical":true}What this number is, and is not. 37 of 37 is telemetry, the sensor saw the technique, measured at a point in time. It is not a detection rate, and we never headline it as one. The analytic layer that turns telemetry into an alert is described in Detection engines, and it is narrower than the telemetry.
Two real rule engines, on the host
Most lightweight agents bundle neither YARA nor Sigma; heavyweight ones bolt a YARA integration onto the side and leave Sigma to a SIEM-side converter. The Whisper sensor runs both, in-process: a genuine SigmaHQ-format rule evaluator over all four telemetry streams, and VirusTotal's YARA-X engine over files and memory. Every finding carries the rule name, its author, its license and its ATT&CK technique onto the wire.
.whisper/; a bad rule is skipped per file, never taken as an excuse to skip the rest.The 79 bundled Sigma rules
79 rules ship, one bundle carrying every platform's layer side by side, with attribution preserved on every one. 34 are upstream SigmaHQ rules bundled verbatim under the Detection Rule License 1.1, each keeping its title, id, author, date, references and tags plus a header naming its exact upstream path. 45 are first-party Whisper rules under the MIT License, written where SigmaHQ carries nothing for a lane we ship, and never presented as SigmaHQ content. No GPL rule packs, ever.
| The 79, by | Split |
|---|---|
| Stream | 61 process creation · 10 file event · 7 network connection · 1 DNS query |
| Platform admission | 21 Windows · 17 Linux · 59 macOS (one bundle, load-time admission per platform, so the columns overlap) |
| Severity | 22 high · 38 medium · 18 low · 1 informational |
An operator rule with the same id overrides the bundled one; the set is capped at 512 rules; aggregation rules are skipped at load because multi-event correlation belongs to the correlators, not to a single-event evaluator.
The YARA lane, and why it counts for nothing here
The YARA side cuts the other way: four rule files ship in the tree, but the default release build carries zero of them. YARA is a build-time opt-in (-tags yara) and the default build ships the engine stubbed out, pinned by a test. So YARA contributes nothing to the 103 above, and the rules are listed here as what the optional build lane carries, not as shipped coverage. That build gate is the only thing keeping YARA off: inside a -tags yara build the engine defaults on exactly like every other engine on this site, {"sensor":{"yara":false}} opts back out, and the compile step, not a runtime key, is what decides whether the default binary you downloaded can ever reach that code path at all.
| Rule | Author | License | What it names |
|---|---|---|---|
MAL_LNX_PLAGUE_BACKDOOR_Jul25 | Pezier Pierre-Henri | DRL 1.1 | The Plague Linux backdoor |
SUSP_LNX_Linux_Malware_Indicators_Aug20 | Florian Roth, Nextron | DRL 1.1 | Generic Linux malware indicators |
APT_MAL_LNX_Kobalos + SSH credential stealer | ESET research | BSD-2 | The Kobalos APT pair (T1204.002) |
Whisper_EICAR_Test_File | Whisper Security | MIT | The self-test rule |
Posture. Sigma matching is pure in-memory work and runs inline. Every full-file YARA scan is scheduled by the calm plane as heavy work, with a 60-second starvation floor so a fresh unknown executable is still scanned promptly on a busy host. Both engines are observe-only: a match emits a finding and does nothing else.
What alerts today: 12 engines and a curated watch
The inventory of the on-host verdict layer, engine by engine, with the technique ids each one's finding actually carries on the wire, and the exact config key that turns it off (a full paste-able opt-out block is on Detection engines). The critical-config watch is listed alongside them but is a different shape: it emits a critical-stamped file event rather than a detection event, and it is counted as such. Backed by 2,112 test functions and 93 fuzz targets in the sensor package alone.
| Engine | How it decides | Techniques | Platforms | Default | Opt-out |
|---|---|---|---|---|---|
| Ransomware correlator | Eight corroborating heuristics in a sliding window: mass write, uniform rename churn, canary tripwires with per-host keyed decoy names, mass delete with backup tamper, gated entropy that also exonerates plain content, tree rollup, low-and-slow pacing | T1486 | Linux · Windows · macOS | on | ransomware:false |
| Recovery-destruction detector | Shadow-copy, snapshot and backup destruction beside the encrypt shape | T1490 | Linux · Windows · macOS | on | ransomware:false (same engine) |
| Driver blocklist | The vulnerable-driver blocklist matched on the live image-load feed | T1068 | Windows | on | none, wired unconditionally |
| Critical-config watch | Writes to a closed, compiled-in allowlist of persistence paths: ld.so.preload, cron, systemd units, sudoers | T1053.003, T1543.002, T1548.003, T1574.006 | Linux | on | configWatch:false |
| Injection sweep | Four memory shapes from the process's own map: rwx anonymous, missing backing, deleted backing, hollowed image; no disassembler, JIT-screened | T1055 | Linux · Windows | on | injection:false |
| Endpoint-Security injection correlator | The same shapes, real-time, off the macOS ES feed | T1055 | macOS | on, feed-gated | injection:false (same switch) |
| Event-chain correlator | write(F), exec(F), connect, ordered and windowed, across process trees; confidence bounded below certainty | T1105 | Linux · Windows · macOS | on | eventchain:false |
| Lateral-movement correlator | Remote-service session shapes folded over the socket and exec streams | T1021.001 to T1021.006 | Linux · Windows · macOS | on | lateralmovement:false |
| Defense-evasion correlator | Two or more distinct evasion classes inside one process tree within a window | T1070, T1562 | Linux · Windows · macOS | on | defenseevasion:false |
| Collection correlator | Screen-capture and clipboard shapes correlated with the file they staged | T1056, T1113, T1115 | Linux · Windows · macOS | on | collection:false |
| Credential-access correlator | LSASS dump shape and browser credential-store reads, file-corroborated | T1003.001, T1552.001, T1555.003 | Windows | on | credaccess:false |
| DGA classifier | On-host burst classification over the DNS qname stream | T1568.002 | Linux · Windows · macOS | on | dga:false |
| JA3/JA4 verdict | The TLS ClientHello fingerprint judged against the graph | T1573 | Linux | on | javerdict:false (tap: jatap:false) |
Every on-host engine is observe-only, and detection is spliced beside the telemetry stream, never into it: an event is always forwarded downstream first, and only then does a detector look at a copy, so detection can never delay, drop or alter telemetry.
The matrix, 15 columns
The graph techniques column is the taxonomy size per tactic; the telemetry column is what we drove and captured in the measured run (it sums to 37). The per-tactic counts do not sum to 712 because a technique can belong to more than one tactic; 712 is the count of unique techniques in the taxonomy, which the graph already carries along with 1,916 actor nodes, 344 of which carry USES_TECHNIQUE edges. MITRE ATT&CK v19 splits Defense Evasion into two columns, which is why 14 canonical tactics draw as 15 here.
| Tactic | Graph techniques | Telemetry, measured | Coverage |
|---|---|---|---|
| Reconnaissance | 46 | - | Infrastructure column. 6 named techniques from the graph. The attacker's own scanning infrastructure. No host-EDR covers this. |
| Resource development | 50 | - | Infrastructure column. 6 named techniques from the graph. Adversary-controlled infrastructure at internet scale. |
| Initial access | 22 | - | Source and destination reputation plus resolver phishing; a bundled rule alerts on DNS lookups of out-of-band interaction services (T1190). |
| Execution | 64 | 1 | Every process exec, with /proc-enriched metadata. Rules alert on netcat reverse shells (T1059) and shell-pipe-to-shell. |
| Persistence | 113 | 4 | Cron, systemd service, .bash_profile, kernel module all captured. The config watch tags cron, systemd, ld.so.preload and sudoers writes with their technique; rules alert on new cron files, launch agents and login items. |
| Privilege escalation | 96 | 2 | Setuid and ld.so.preload captured; the driver blocklist alerts on vulnerable-driver loads (T1068). Token manipulation and kernel exploitation stay on the roadmap. |
| Defense evasion | 148 | 3 | Obfuscation (base64), hidden files, chmod captured; the injection sweep names T1055 and the defense-evasion correlator names T1070 and T1562, both on by default. Deeper unhooking is the deep tier. |
| Impair defenses | 56 | 2 | Log deletion and service stop captured; snapshot and backup destruction alert as T1490. |
| Credential access | 67 | 4 | /etc/shadow, SSH keys, bash history, AWS creds captured; the Windows correlator names LSASS dump shape (T1003.001), browser credential stores (T1555.003) and credentials in files (T1552.001), on by default. |
| Discovery | 49 | 11 | Every recon command captured (uname / ps / ip / ss / find / getent). |
| Lateral movement | 23 | - | The socket collector and the per-process connection fold back east-west directly; the lateral correlator names the six T1021 remote-service sub-techniques. |
| Collection | 41 | 3 | Staging and archive captured; the collection correlator names screen capture (T1113), clipboard (T1115) and input capture (T1056); T1113 and T1115 are proven firing end to end on Windows. |
| Command and control | 45 | 3 | Infrastructure column, hybrid. The graph scores every destination while the socket collector, the net-tap and DNS-to-process attribution capture the channel. 5 named techniques including the DGA burst. |
| Exfiltration | 19 | 1 | Infrastructure column, hybrid. Destination reputation, per-/128 egress metering, and an exfil-fusion join that ties a resolve to the connect that followed it. 2 named techniques. |
| Impact | 33 | 3 | Ransomware-encrypt and dd-wipe captured; the T1486 and T1490 engines are on by default and observe-first, verdict held rather than blocking. |
| Total | 712 | 37 | 103 named techniques, 14 of 14 tactics |
What we do not count
The manifest keeps an exclusion ledger, and these are deliberately outside the 103:
- T1055.012 process hollowing and T1620 reflective code loading. The injection engines classify both shapes and carry a stable wire signal for them, but the finding's technique field emits the parent T1055. Counted inside T1055 until the wire names the sub-technique.
- The YARA lane. The only rule carrying a technique meta is the EICAR self-test, and the default build ships zero YARA. Its lane is a separate build.
- The ETW Threat-Intelligence feed. Built, and dark on every shipped build: it needs Microsoft's anti-malware attestation and a protected-process launch. No count impact, since T1055 is already carried by the region sweep.
- The
sshd_configwatch. Labelled adjacent to T1098.004 in the allowlist, not a direct detection of it, so it is not counted as one.
Telemetry is likewise never summed into these counts. The five raw streams (exec, file, conn, dns, and image-load on Windows) are visibility, listed apart, and they are what the 37-of-37 figure measures.
Telemetry vs analytic, the load-bearing distinction
The telemetry column and the telemetry rows are visibility, the sensor sees it, measured 100% across the run. The analytic layer, a verdict that alerts, is the graph reputation (live for C2 and exfiltration destinations and for file hashes), the per-process trust tier, the four infrastructure columns, and the on-host engines and rule sets inventoried above: 103 named techniques. That layer is narrower than the telemetry and growing, we report both, and we never claim an alert we cannot demonstrate. Every on-host engine tops out below full certainty on purpose: intent-certainty and destination reputation are the graph's second pass to add. A fired verdict is held by default, not blocked, until you opt into a response lever. See Detection engines for the engine-by-engine status.
The roadmap for the verdict layer, named plainly: ransomware detection ships observe-first today and copy-on-write rollback is designed and enforcement-gated; the Windows deep tier is live and proven on Windows Server 2022, with the ETW-TI feed built but dark behind Microsoft's attestation; the behavioral correlators now ship on by default and stay in their live-tuning pass regardless, so tuning continues in the open rather than behind an opt-in. One gap we keep in view and do not paper over: we have no MITRE Engenuity ATT&CK Evaluation entry, and no Gartner placement. We are targeting an Evaluation in 2027, and until then every number on this page is our own measurement, published with the method beside it so you can check it yourself.